0. Microeconomics Curriculum
- Basic Economics
- Supply / Demand
- Production / Cost
- Imperfect Competition / Games
- Factor Markets
- Government
1. Basic Economic Concepts
1.1 Scarcity
1.2 Opportunity Cost and the PPC
1.3 Comparative Advantage and Trade
1.4 Demand
- T - Tastes and preferences
- R - Related goods and services
- I - Income of consumers
- B - Buyers
- E - Expectations of the future
1.5 Supply
- I - Input prices
- N - Number of suppliers
- E - Expectations of future
- R - Related products
- T - Technology
1.6 Market Equilibrium
Elasticity
- S - Substitutes
- P - Proportion of income
- L - Luxury or necessity
- A - Addictive
- T - Time
2. Economic Indicators and the Business Cycle
Circular Flow

GDP
Income = Expenditures = Value Added
- GDP = Aggregate Demand
- Y = Income
- C = Consumption Expenditure = household spending on goods/services
- I = Investment Expenditure = firms buying stuff (capital - machines, factories), or increasing stock (making computers)
- G = Government Spending = government spending on goods/services (eg. infrastructure, paying employees, NOT welfare → that’s transfer payments)
- X = Exports
- M = Imports
Restrictions of GDP
- Volunteer work (charity, stay at home)
- Inequality
- Negative things (repairs, weapons)
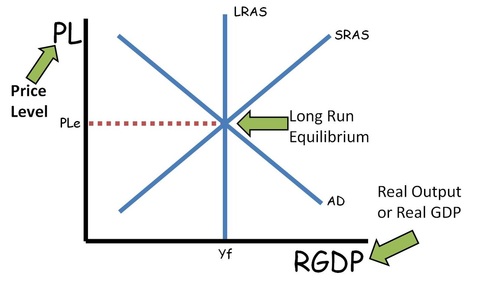
Output Gap = Actual - Potential GDP
Unemployment
Employed = number of people currently employed (part + full time) Unemployed = number of people looking for work but not employed Underemployed = number of part time people that would rather work full time, or people with jobs that don’t make full use of their qualifications
- Low = 5%, High = 8%
Labor force = Employed + Unemployed Labor force participation rate: People not seeking work
- Excludes children
- retirees
- adult students
- those who can’t work (illness or disability)
- those who don’t want to work
- those who have given up looking for work (discouraged)
Employment rate excludes:
- Discouraged workers
- Marginally attached workers (eg. taking time off)
Types of unemployment:
- Structural Unemployment: Economic restructuring making skills obsolete, Oversaturated labour market, Change in geographic location of industries
- Frictional Unemployment: Unemployment caused by new entrants into the job market and people quitting a job to find another
- Seasonal Unemployment: Unemployment caused by seasonal work
- Cyclical (demand deficient) unemployment: Unemployment caused by the business cycle
Natural Rate of Unemployment
- Natural rate: Normal rate
- Above natural rate during growth
- Below natural rate during recession
- Cyclical Unemployment: Deviation from the natural rate
- Change in labour force characteristics
- Changes in labour market institutions
- Changes in government policy
The Business Trade Cycle: Economic Fluctuations
Economic Fluctuations = tied to success of agriculture and stuff
Inflation
CPI = Consumer Price Index = Price of a basket of goods
- Inflation: CPI up
- Deflation: CPI down
- Disinflation: Inflation concave down
- Hyperinflation: Inflation concave up
- Stagflation: Recession + Inflation
 Phases of the Business Cycle
 - Expansion = when there is positive growth in real GDP
- Employment rises, prices rise
- Peak = the cycle’s max level of real GDP marks the end of an expansion
- Unemployment falls, prices rise
- Contraction = After peak, there’s falling real GDP (negative growth)
- Recession = 2 quarters of contraction
- Depression = long recession
- Trough = After contraction, expansion again
3. National Income and Price Determination
Fiscal Policy
Fiscal Policy = when legislature does stuff Monetary Policy = when central banks do stuff
- To encourage or discourage growth
Policy Rate = Central Bank Rates Prime Rate = Rate for Bank’s best customers Bank Lending Rate = Rate between banks
Shocks and smoothing
Shocks = unexpected event that change GDP
- Good/bad fortune that strike households
- Self-insurance = save and borrow
- Co-insurance = support from social network / governments
- This means that households prefer to smooth their consumption (save/borrow) and that they are altruistic
- Good/bad fortune that strike economies
- Co-insurance becomes less effective, but is still necessary
- People used to practice trust, reciprocity, and altruism
Smoothing Consumption = making consumption plans based on expectations of the future
- Readjust long-run consumption if permanent shock
- Don’t if temporary
Consumption smoothing on a macro scale
- Stabilization
- Limits: Credit constraints, weakness of will, limited co-insurance
- Credit constraints = limit on ability to borrow
- Weakness of will = no passion
- Limited co-insurance = less altruism
Government size vs GDP
- As governments get bigger, GDP stabilizes and is less susceptible to shocks
Sticky = nominal price is resistant to change → moving up / down curve Automatic Stabilizer = Counteracts the business cycle without any government policy (unemployment, welfare)
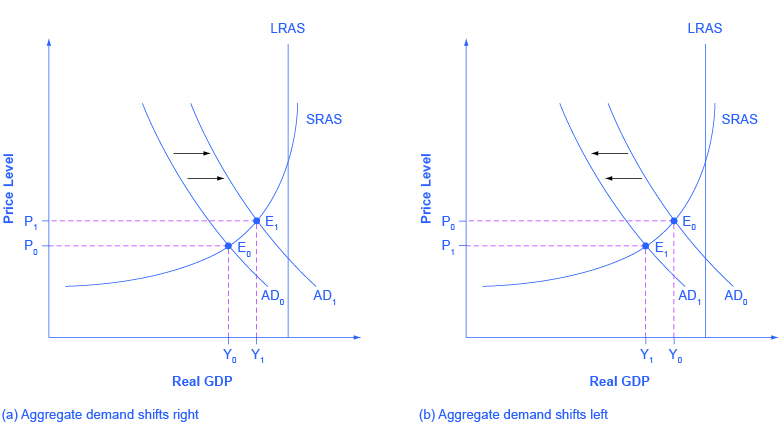
AD-AS Model
Consumption Function
Aggregate Consumption has:
- Autonomous Consumption (how much you will spend anyway)
- Consumption dependent on income

- Aggregate Demand (AD) = consumption function + investment
- Investment is independent of consumption
- Slope <45 deg
- 45 deg line is when Y = AD
Slope of consumption function = marginal propensity to consume
- Poor households with credit constraints have large MPC
- Wealthy households have small MPC
- Expectations of the future are reflected in autonomous consumption
Shifts in AC (Aggregate Consumption) function
- Changes in expected future
- Disposable income
- Changes in aggregate wealth (eg. stock market UP, recession DOWN)
Assumptions about the spending multiplier
- Producers are willing to supply additional outputs at a fixed price
- 1k more goods
- Given interest rate
- Just looking at C and I
Spending increases by $100b
- Aggregate output increases but $100b
- Multiplier Effect: Some of the $100b goes to people, which goes to firms, which goes to people (multiple rounds of spending)
MPC and MPS
- Higher for richer people
Total increase in real GDP =
(1+MPC+MPC^2+MPC^3+\ldots)*$100bThe Multiplier and the Great Depression
- most economists thought 1929-33 was a collapse in investment spending
- but as economy shrank, it also fell, multiplying the effect on real GDP
- our taxes and spending > 1929
- taxes and spending are stabilizers
John Maynard Keynes (Keynesian economics)
- Untangled the Depression and the multiplier effect
- Tax more + spend less when times are good, tax less + spend more when times are bad
Household Wealth
- broad wealth = broad assets - debt
- target wealth = aim
- precautionary saving = more saving
- fall in expected earnings ⇒ precautionary savings
Changes in house prices
- change household wealth (home equity)
- change in credit constraints (harder to borrow)
- You pay capital gains tax on a house that isn’t your primary residence (house flipping)
Investment: Aggregate investment function (like aggregate consumption)
4. Financial Sector
Financial Assets
- Stocks = investment into company
- Bonds = investment into government
- Equity = Value - Debts
- Liquidity: House < Bonds < Savings account < Cash
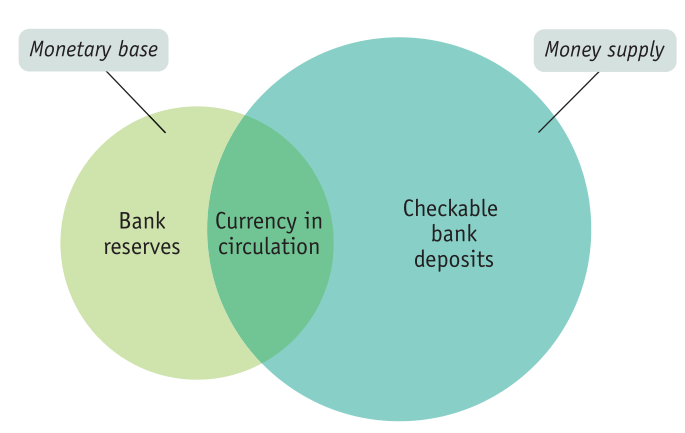
What is money?
- Financial asset to purchase gods / services
- Currency in Circulation: held by the public
- Checkable in bank accounts: demand deposits
- Money Supply: total of financial assets
- M1 = Public currency and coins, checkable deposits, checks
- M2 = M1 + Savings deposits, small time deposits, shares in mutual funds
Purpose of money (requires trust)
- A medium of exchange
- A store of value
- A unit of account
- Allows purchasing power to be transferred
- Gershan’s Law: “bad money drives out good” - metallic vs paper money, fiat money
Income (money) vs Wealth (capital)
- Net income = gross income - depreciation
- Earnings = income from labour
- Saving = income not consumed
- Investment = expenditure on capital goods
Banking
Mutual Gain
- People spend time by browsing / investing / lending / saving
- Conflict of interest between borrowers and lenders over interest rate
- Principle-agent relationship - lender (principle) cannot guarantee borrower (agent) pays back
- Lenders often require borrowers to contribute their own funds *collateral)
- This means that poor people can’t get money (credit constrained / excluded)
- Bank account needs address → can’t get paid → Money Mart / microfinancing
- Gini Coefficient is a measure of inequality
How banks create money
- Lend money to other people who deposit to other banks
- Reserve Ratio: how much you have to keep
- Excess Reserves: 90% of total reserves
- Money Multiplier =
- Broad money = base money + bank money
Risk
- Banks provide maturity transformation (after period of time)
- They also provide liquidity transformation because loans are frozen (illiquid)
- Default Risk
- Liquidity risk
- Bank run:
- Everyone asks for money
- Bank makes bad investments
Banking Business
- Cost = Operational, Interest
- Revenue = Interest, repayment (they want you to invest)
- Expected return = return on loans * default risk (99%, 80%, …)
- Mortgages > normal loans because no default risk
- Balance Sheets = Equity = Net Worth = Assets - Liabilities
- If Net Worth < 0 , the bank is insolvent / bankrupt
- Most common debt is consumer debt (credit card debt)
Money Market
- Banks borrow from each other / central banks at a short term interest rate
- Policy Interest rate: Set by Fed
- Bank lending rate: average interest rate charged by banks to households
- Prime Rate: Rates for best customers
- Fixed vs Variable (prime, prime+1)
Monetary Policy
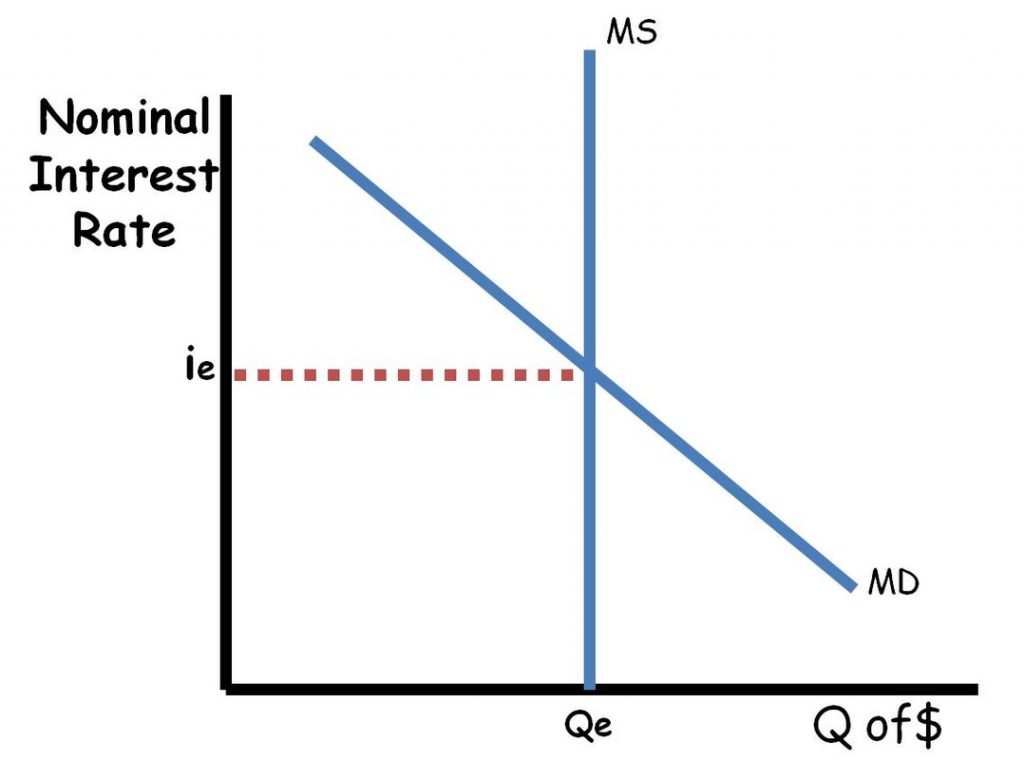
- To Increase , the Bank of Canada buy bonds from the market
- To decrease , they sell bonds
- Higher interest = Reduced AD = Lower inflation = higher unemployment
Loanable Funds Market
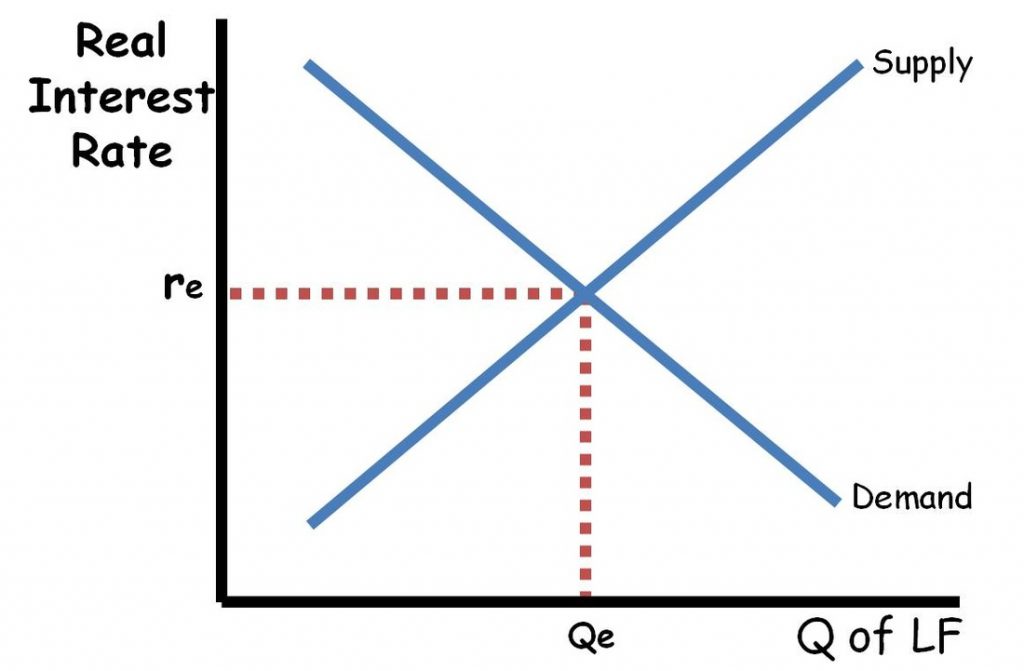 What’s being bought and sold is money that has been saved
- Borrowers demand loanable funds
- Savers supply loanable funds
- When governments borrow, supply decreases
5. Stabilization Policy
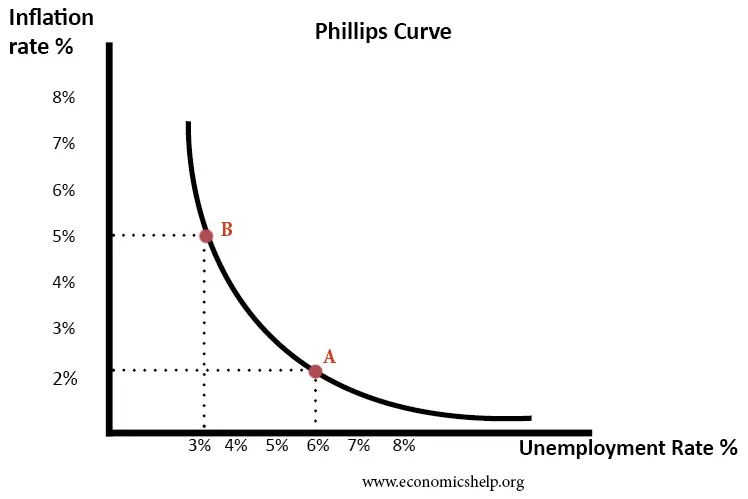
The Phillips Curve
Inflation and Unemployment are inversely proportional
Money Growth and Inflation
Velocity of Money
- P = price level
- T = aggregate real value of transactions
- M = total amount of money in circulation
Fiscal Policy
How Governments React to Economic Fluctuation
- Government size (spending on health/education, higher tax rates which reduce the multiplier → smaller growth = smaller crash)
- Unemployment benefits (also pension plans)
- Intervention (fiscal policy)
Long-run
- ”we’re all dead”- Keynes
- The economy is self correcting (growth w/o government intervention)
- People will acclimatize to having less and doing more (eg. Black Plague)
- Stabilization policy to reduce the severity of recessions
Macro Policy
- Demand Shocks
- If policy could perfectly anticipate shifts of the AD curve
- Price stability is good (Inflation in 70s-80s was high, 2010s was good, 2020s bad)
- Supply Shocks
- Much harder
- If people are willing to work for lower wages → Input prices go down → Supply shifts right → Aggregate Supply shifts right
- Unemployment vs Inflation
- Lower unemployment = higher inflation
Taxes and Government Spending
- Funds → Government through taxes and government borrowing
- Funds ← Government through purchases of goods/services, transfers
- When spending increases and taxes are cut, economy expands
- Trickle Down Economics
- Fiscal policy shifts the Demand curve
Expansionary and Contractionary Fiscal Policy
- This can eliminate an inflationary gap Expansionary (increasing AD)
- Increases in gov’t purchases of goods and services
- cut in taxes
- increases in gov’t transfers
Contractionary (decreasing AD)
- reduction spending
- more taxes
- reduction transfers
Problem: Lags in Fiscal Policy Time Sinks:
- Realizing the recession / inflationary gap + analyzing data
- Government developing a spending plan
- Implementing the plan
Multiplier Effect
- Changes in taxes, transfers, government spending
- Multiplier effect: Increase in real GDP > initial reduction in aggregate spending
- Spending Multiplier
- Tax Multiplier
- There is no **first round of spending ** / the initial injection isn’t all spent
- Changes in government purchases > changes in taxes / transfers
Balanced Budget Multiplier
- Government increases taxes to cover spending
- Automatic Stabilizers: Progressive taxation, Healthcare, food stamps
- Discretionary fiscal policy: deliberate actions
Stabilizing
- Government spending (large and exogenous)
- Higher tax rate lowers the multiplier
- Unemployment insurance
- Deliberate intervention via fiscal policy
The paradox of thrift
- If a family is worried about falling wealth, they spend left
- With an entire economy, spending = income
- The aggregate attempt to increase savings leads to a fall in aggregate
- Fallacy of composition = what’s true for one part of the economy is not true of the whole
- Problem with the EU: if Greece has problems, the Euro is reliant on the ECB
- Fiscal policy becomes important
Fiscal Stimulus
- Budget Balance = T-G
- Budget Surplus is when Revenue > spending, Deficit is opposite
Government debt
- Debt to GDP ration is a good indicator of government success
- They can just roll back debt by selling new bonds
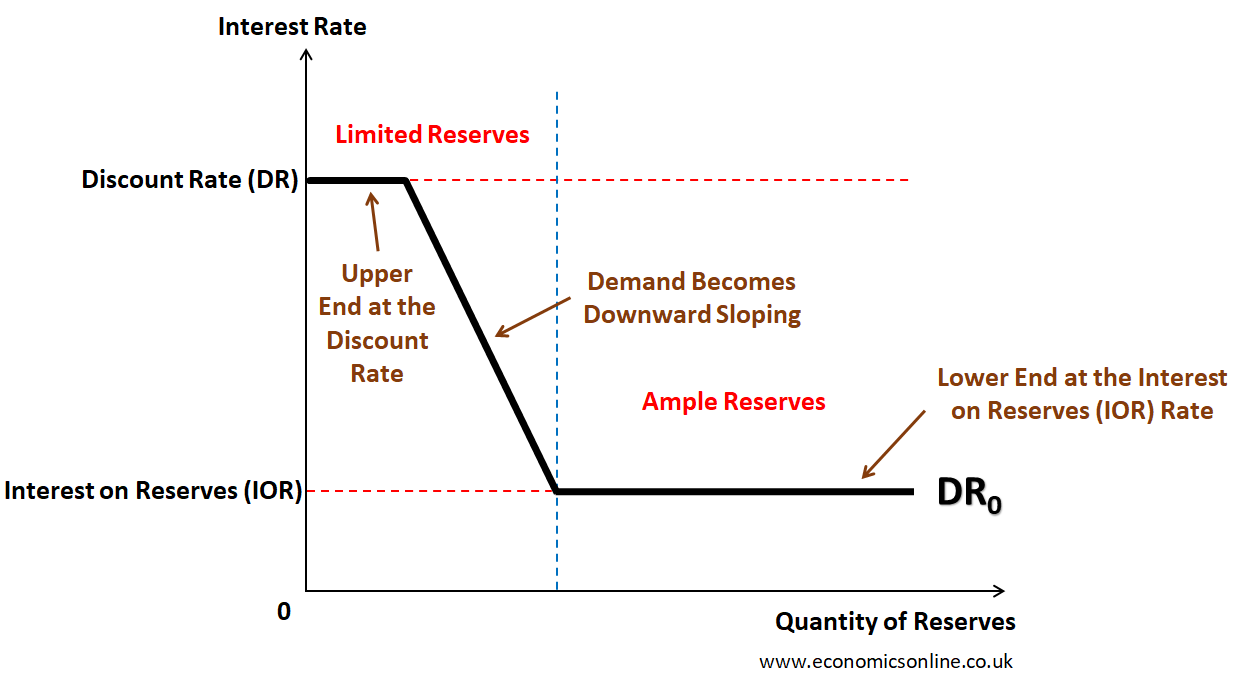
Reserves Market
6. International Trade and Finance
6.1 Balance of Payment Accounts
CA + CFA = 0
CA = Current Accounts (always balanced)
- Net exports (purchases or sale of goods)
- Money transfers (receiving money)
- Investment Income (overseas assets)
- Net unilateral income Net Exports = Trade Balance = Exports (credit) - imports (debit)
- Surplus / Deficit
CFA = Capital and Financial Account (not always balanced)
- Balance of payments for assets (purchases / sale of bonds)
- Financial capital transfers (physical assets, FDI) Financial capital going into an economy is a surplus (financial capital inflow)
Credit vs Debit
- Money in = Credit
- Money out = Debit
- Sum of Credit = Sum of Debit
6.2 Exchange Rates
Exchange Rate = The price of one currency in the terms of another
- Appreciation = more valuable
- Depreciation = less valuable
- When you buy something from another country, you use their currency
6.3 The Foreign Exchange Market
Foreign Exchange Market = Exchanging currency
- Demand for currency comes from demand for goods, services, financial assets
- Exchange rate is inversely proportional with quantity demanded
- Equilibrium = exchange rate and quantity demanded are equal
6.4 Effects of Policies and Conditions
Who participates in the market?
- Those looking to purchase international goods
- Those who want to earn income from another country
Determinants of currency demand:
- International Demand for goods and services
- International Demand for assets
- Fiscal / Monetary Policy
Determinants of Currency Supply
- Domestic demand for other country’s goods and services
- Domestic demand for other country’s goods assets
- Protectionist policies (tariffs, quotas)
6.5 Changes in the Foreign Exchange Market
Shifting AD → Net Exports = Export - Import
- Fluctuating currency values → changes relative price of goods
- Changes in the relative price of goods → changes next exports
- ex: US goods become more expensive to Canadians → US exports fall
6.6 Real Interest Rates and International Capital Flows
- Capital inflow: Supply shifts right
- Capital flight / outflow: Supply shifts left
Changes in interest rates:
- Monetary policy:
- Expansionary: decrease rates
- Contractionary: increase rates
- Demand for money:
- Increase: increase
- Decrease: decrease
- Budget Balance
- Deficit: increase
- Surplus: decrease
- Households saving
- Increase: decrease
- Decrease: increase
Financial Capital chases high interest rates
- Investors will gravitate towards higher returns (higher interest rates)
Practice Exam
- Economic growth = per capital real gross domestic product
- Reducing price level = decrease spending, increase interest rates
- Spending increase + Interest increase = interest increase + unchanged private investment
- Unanticipated increase in gov spending shifts LR Phillips Curve left (less unemployment)
- Crowding Out = private investment spending decreases b/c interest rates increase b/c government borrowing increases
- Anticipated expansion of MS increases nominal GDP and price
- Only selling to other countries increases current account surplus
- Decreasing taxes means higher nominal GDP
- To reduce unemployment, buy bonds to decrease interest rate and increase AD
- Central bank selling bonds to commercial banks decreases MS
- Current account deficit is financed by a surplus in financial (capital) amount
- Firm’s optimism about future income shifts AD right, increasing real output and price
- Balance = Deposits - Withdrawals
- tight monetary policy = higher interest and less private investment
- multiplier = 1/rr
- Recession caused by a decrease in AD
- More discouraged workers makes unemployment and labor force participation rate decrease
- Gov spending down and private saving up causes real interest down and interest-sensitive spending up
- Increased budget deficit = gov spending > tax revenue, and central bank increases MS
- CPI doesn’t fully measure inflation because improvement in quality of goods/services
- Demand-pull inflation increases real output, Cost-push inflation decreases it
- Buying bonds increases MS
- higher interest = lower inflation = higher employment